Phoenix-Area Scorpion Sting Reports Increased in Spring 2026
Pest Science Group
From March through June 2026, the Banner Poison & Drug Information Center recorded 1,180 scorpion stings in Maricopa County. Scorpion stings alone exceeded the 1,148 bites and stings of all kinds reported to Banner during those same months in 2025.
At Pest Science Group, we’re also hearing more reports of people being stung. We suspect Arizona bark scorpion stings have increased and that more patients may be receiving Anascorp, the scorpion antivenom. Banner groups scorpion species together, and its monthly sting counts don’t tell us how often hospitals used antivenom.
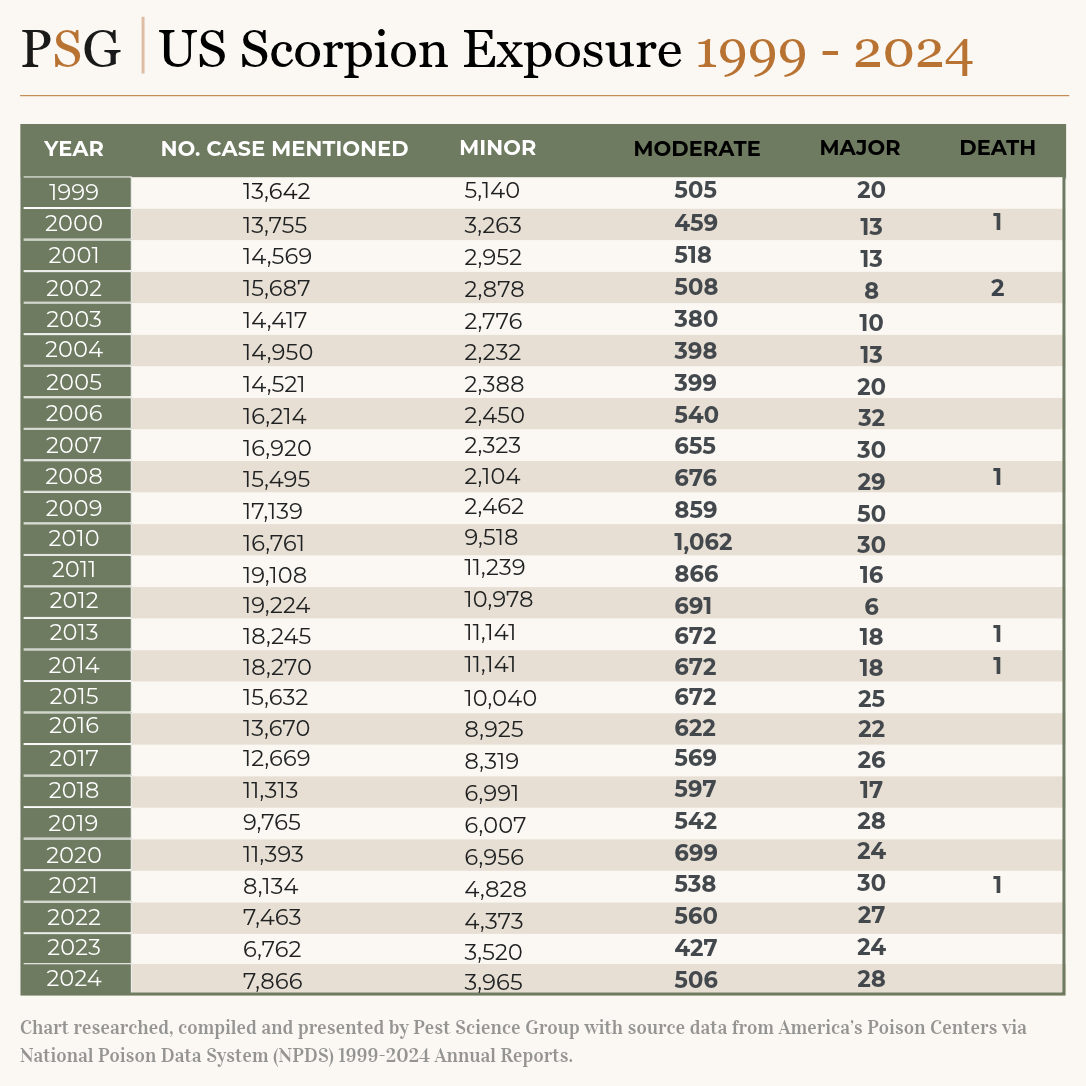
We follow the Annual Report of the National Poison Data System, published by America’s Poison Centers. It typically comes out the following December, so we expect the 2025 report in December 2026 and the 2026 report in December 2027. Below is a summary of reported scorpion exposures from 1999 through 2024.
| Year | No. case mentioned | Minor | Moderate | Major | Death |
|---|---|---|---|---|---|
| 1999 | 13,642 | 5,140 | 505 | 20 | Not specified in supplied chart |
| 2000 | 13,755 | 3,263 | 459 | 13 | 1 |
| 2001 | 14,569 | 2,952 | 518 | 13 | Not specified in supplied chart |
| 2002 | 15,687 | 2,878 | 508 | 8 | 2 |
| 2003 | 14,417 | 2,776 | 380 | 10 | Not specified in supplied chart |
| 2004 | 14,950 | 2,232 | 398 | 13 | Not specified in supplied chart |
| 2005 | 14,521 | 2,388 | 399 | 20 | Not specified in supplied chart |
| 2006 | 16,214 | 2,450 | 540 | 32 | Not specified in supplied chart |
| 2007 | 16,920 | 2,323 | 655 | 30 | Not specified in supplied chart |
| 2008 | 15,495 | 2,104 | 676 | 29 | 1 |
| 2009 | 17,139 | 2,462 | 859 | 50 | Not specified in supplied chart |
| 2010 | 16,761 | 9,518 | 1,062 | 30 | Not specified in supplied chart |
| 2011 | 19,108 | 11,239 | 866 | 16 | Not specified in supplied chart |
| 2012 | 19,224 | 10,978 | 691 | 6 | Not specified in supplied chart |
| 2013 | 18,245 | 11,141 | 672 | 18 | 1 |
| 2014 | 18,270 | 11,141 | 672 | 18 | 1 |
| 2015 | 15,632 | 10,040 | 672 | 25 | Not specified in supplied chart |
| 2016 | 13,670 | 8,925 | 622 | 22 | Not specified in supplied chart |
| 2017 | 12,669 | 8,319 | 569 | 26 | Not specified in supplied chart |
| 2018 | 11,313 | 6,991 | 597 | 17 | Not specified in supplied chart |
| 2019 | 9,765 | 6,007 | 542 | 28 | Not specified in supplied chart |
| 2020 | 11,393 | 6,956 | 699 | 24 | Not specified in supplied chart |
| 2021 | 8,134 | 4,828 | 538 | 30 | 1 |
| 2022 | 7,463 | 4,373 | 560 | 27 | Not specified in supplied chart |
| 2023 | 6,762 | 3,520 | 427 | 24 | Not specified in supplied chart |
| 2024 | 7,866 | 3,965 | 506 | 28 | Not specified in supplied chart |
Chart researched, compiled and presented by Pest Science Group with source data from America's Poison Centers via National Poison Data System (NPDS) 1999-2024 Annual Reports.